TangleML Studio UI Guide
TangleML Studio provides a comprehensive web-based interface for building, managing, and running machine learning pipelines. This guide walks you through the main areas of the application: Dashboard, Editor, Pipeline Run, and Settings.
Dashboard
The Dashboard is your home base for navigating pipelines, runs, and components across your TangleML instance. A persistent sidebar on the left lets you switch between views without leaving the dashboard layout.
Sidebar navigation
The dashboard sidebar contains the following entries:
- My Dashboard — overview of favorites, recently viewed items, recently used components, and your runs.
- My Pipelines — your draft pipelines, with a preview of favorited pipelines on top.
- All Runs — every pipeline run on your TangleML instance, with a filter bar for narrowing results.
- Components — a searchable browser for User Components, the Standard Library, and Published Components.
- Favorites — every pipeline and run you've starred, in a single grid with search and pagination.
- Recently Viewed — the pipelines and runs you've most recently opened.
- Learning Hub — guides, FAQs, ready-made example pipelines, and tips for getting the most out of TangleML. See Learning Hub.
The bottom of the sidebar provides quick links to the documentation, the Settings page, and the application footer (About, Give feedback, Privacy policy, version). A rotating Tip of the day also appears near the bottom of the sidebar.
My Dashboard
The My Dashboard view is the landing page when you visit the dashboard. It surfaces the things you're most likely to want to come back to:
- Favorites — up to five most recently starred pipelines or runs. Hover a row to reveal an inline X button that removes the item from favorites without leaving the page.
- Recently Viewed — up to five most recently opened pipelines or runs, with a relative timestamp showing when you last viewed each one.
- Recently Used Components — up to five most recently opened components from the Components view.
- My Runs — a compact list of up to ten runs you created, ordered by most recent first.
Each preview block has a View all → link in the heading that takes you to the full view for that section.
My Pipelines
The My Pipelines view manages your draft pipelines stored locally in browser storage.
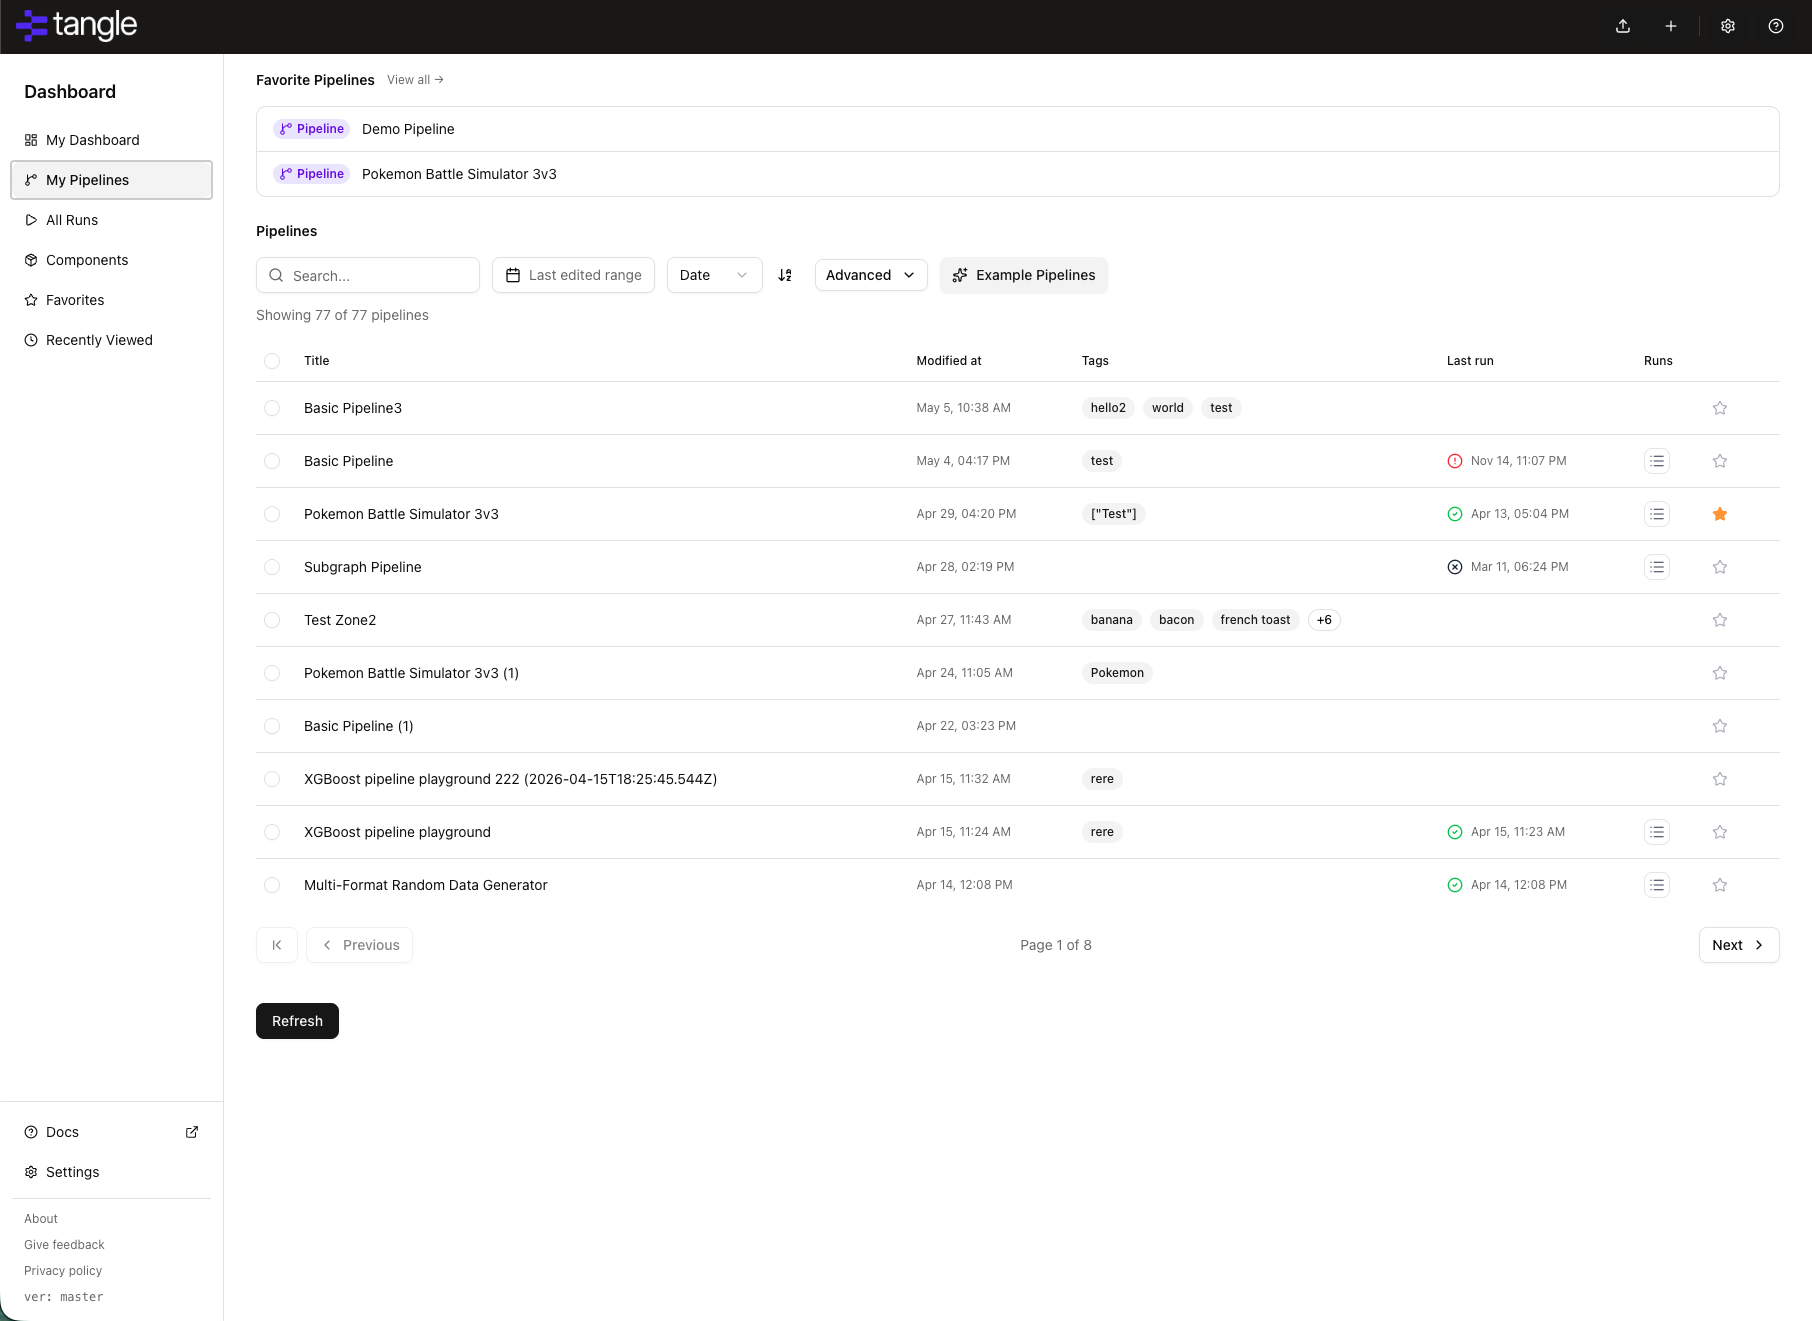
- Favorite Pipelines preview: When you have one or more favorited pipelines, a preview block appears at the top of the view with up to five of them. The block is hidden automatically when you have no favorited pipelines so it doesn't take up space.
- Local storage: All draft pipelines are stored in your browser's local storage. For more on local vs shared storage, see Pipelines Persistence.
- Filter and search: Use the filter bar to search pipelines by name. Matching text is highlighted in search results. Sort by name or last modified date.
- Tags: Pipelines with tags display them directly in the list row for quick identification.
- Bulk operations: Select multiple pipelines using checkboxes for bulk delete operations.
- Run history: Pipelines with existing runs display a "runs" popover showing execution history.
- Quick actions: Edit, duplicate, or delete pipelines directly from the list.
All Runs
The All Runs view displays a comprehensive list of all pipeline runs on your TangleML instance.
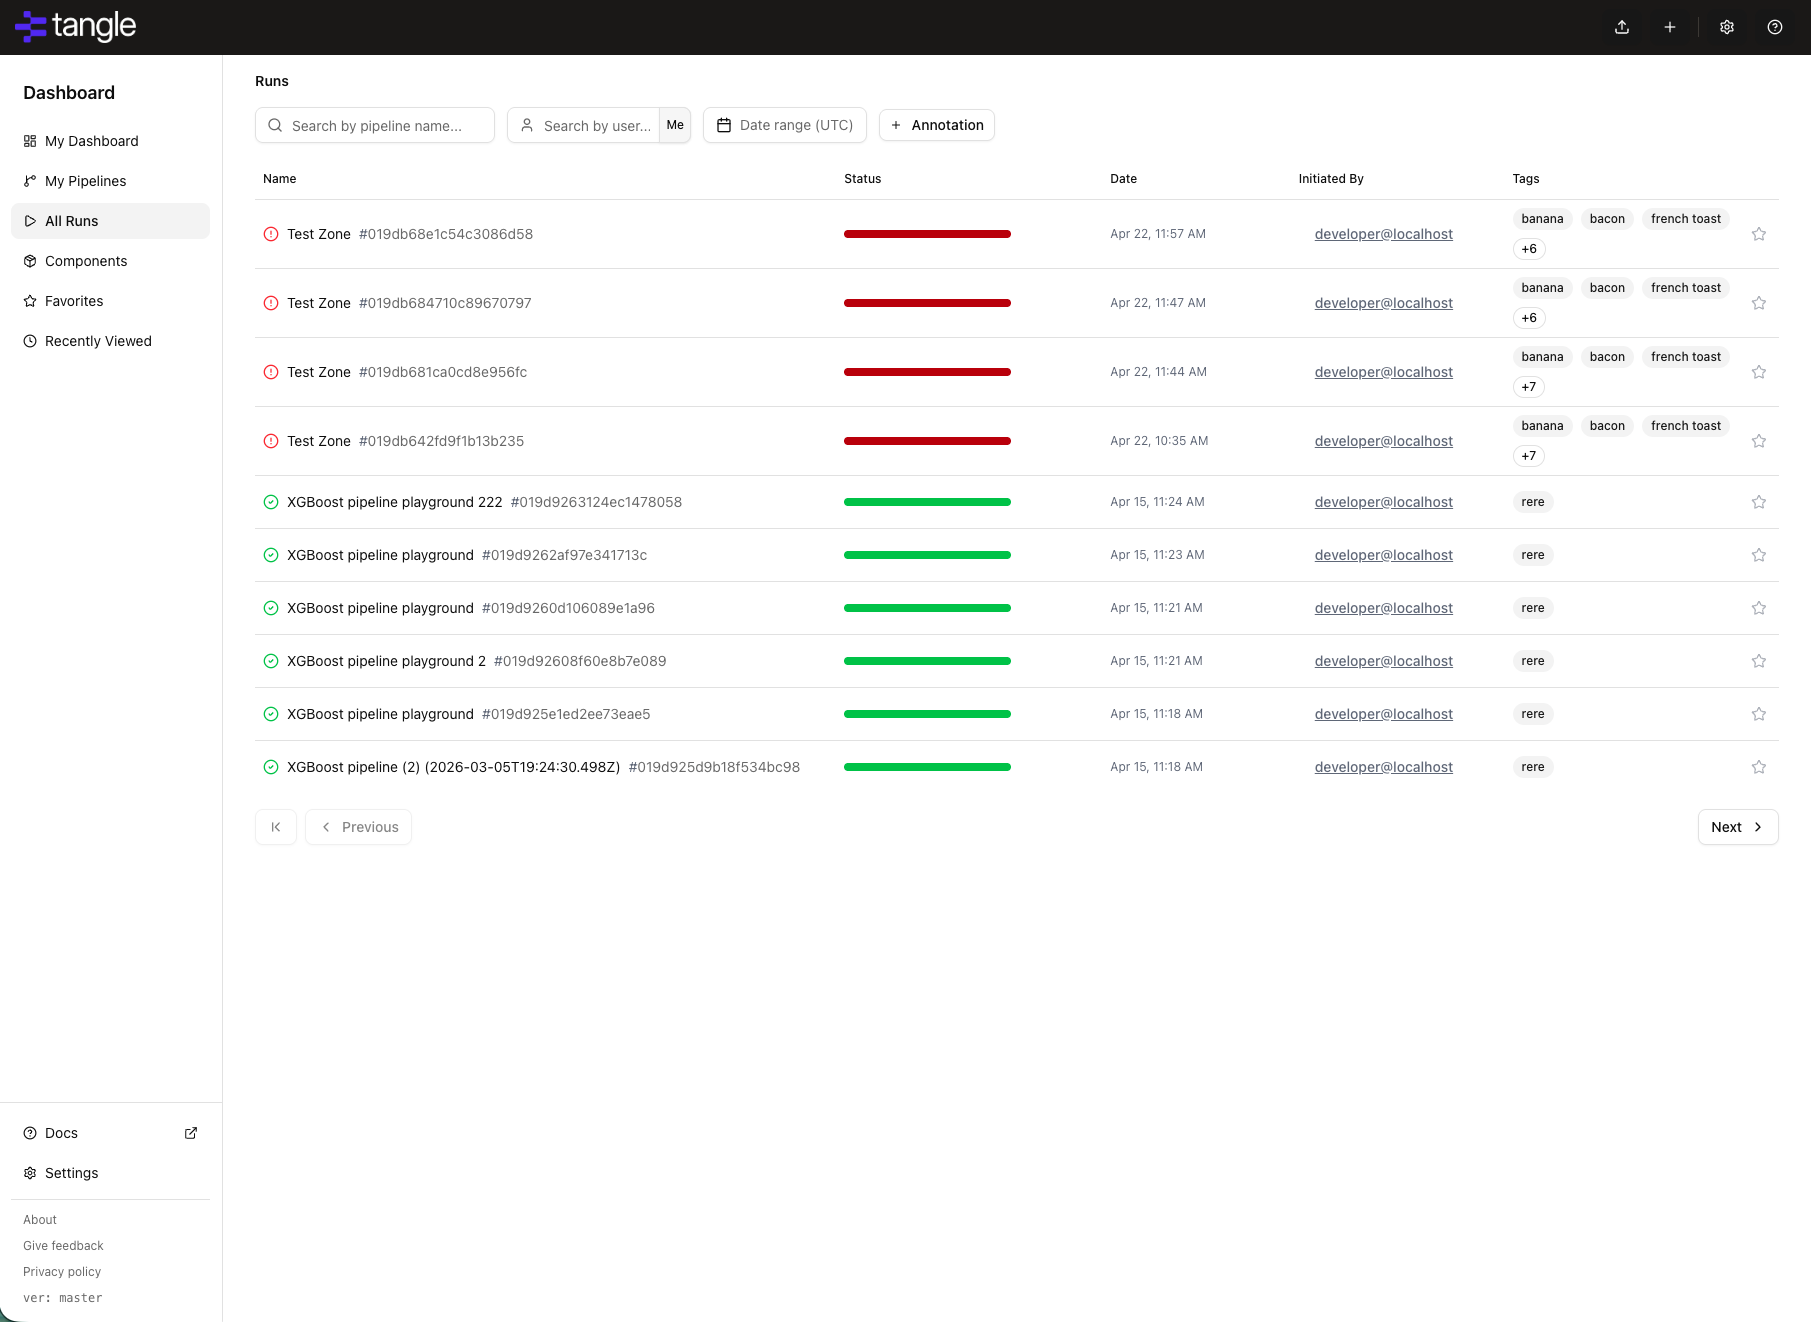
The runs list includes a filter bar with the following controls:
- Name search: Filter runs by pipeline name. Partial matches are supported.
- Created by: Filter to show only runs created by a specific user. You can also click a user's name in any run row to instantly filter the list to that user.
- Date range: Narrow results by creation date using start and end date pickers.
- Annotation filters: Add key/value annotation predicates to filter runs by custom metadata attached at submission time.
- Active filter chips: Active filters appear as removable chips below the filter controls. Click Clear all to reset.
- Run status: View the current status of each run (Running, Succeeded, Failed, Cancelled).
- Run origin: A small icon at the end of each row indicates where the run was submitted from — a window icon for the Tangle web app, a bot icon for programmatic submissions (CLI or AI), and a question-mark icon when the origin is unknown. Hover the icon for a tooltip describing the source.
- Quick access: Click on any run to view detailed execution information.
Components
The Components view is a two-pane browser for every component available to your TangleML instance:
- Left pane: A collapsible list grouped into User Components, Library Components (the standard library, organised as a folder tree when you're not searching), and Published Components (components published to the connected backend). Use the search box at the top to filter all three groups by name or author.
- Right pane: When you select a component, this pane shows its name, author, digest, description, GitHub source links (when available), inputs and outputs, and a sticky source-code viewer with the full YAML definition.
The selected component is reflected in the URL, so you can share a link to a specific component with collaborators.
Favorites
The Favorites view shows every pipeline and run you've starred as a card grid. Each card displays the item's type, name, and ID, and reveals an X button on hover for removing the item from favorites.
- Search: Filter favorites by name or ID. The search field clears search state with the inline X button.
- Pagination: Favorites are paginated 20 per page, with previous/next controls beneath the grid when there is more than one page.
Recently Viewed
The Recently Viewed view lists the pipelines and runs you've most recently opened, as a card grid with relative timestamps. Items are paginated 20 per page. Components are tracked separately and surface in Recently Used Components on My Dashboard, not in this list.
Editor
The Editor is the heart of TangleML Studio, providing an intuitive drag-and-drop interface for building machine learning Pipelines.
Layout overview
The Editor consists of four main areas:
- Top bar: Quick access to manage pipelines.
- Left Panel: Pipeline controls and component library.
- Canvas: Central workspace for visual pipeline construction.
- Right Panel: Context-sensitive information panel.
Top bar
The top bar provides quick access to essential functions:
- Pipeline name: Shows the current pipeline's name. Click to edit and rename your pipeline.
- Import pipeline: Load a pipeline into the editor from a file or by pasting YAML content.
- New pipeline: Start a fresh, empty pipeline project.
- Backend status: Check the status of your backend connection at a glance.
- Settings: Navigate to the Settings page to configure your backend connection, personal preferences, beta features, and secrets.
Left panel
The left panel organizes pipeline management and component access.
Pipeline actions
- Save Pipeline: Saves current state to browser local storage
- Save Pipeline As: Creates a copy with a new name
- Export Pipeline: Downloads pipeline as YAML file
- Import Pipeline: Load from file or paste YAML directly
Runs and submission
- Submit Run: Immediately schedules the current Pipeline for Execution
- Recent Pipeline Runs: Displays popover with recent runs for quick access
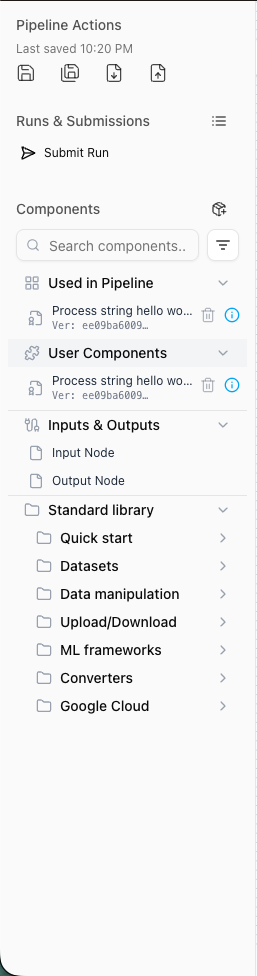
Components
Search functionality:
- Search by: Name, input name, input type, output name, or output type
- Toggle between partial match (default) and exact match
- Example: Search
CSVto find all CSV-related components
Component categories:
- Used in pipeline: Shows all components currently in your pipeline
- Click any component to navigate directly to it on the canvas
- User components: Your personal component library
- Components created or imported by you
- Stored locally in browser storage
- Special components: Input and output nodes for pipeline parameters
- Standard library: Hierarchical collection of standard components
- Data manipulation tools for various formats
- Machine learning frameworks (PyTorch, XGBoost, TensorFlow, TFX)
- Common operations and transformations
Each component has an info icon (ⓘ) that opens a detailed dialog with three tabs:
- Details: Complete component information
- Input/Output: Lists all inputs and outputs with metadata (required status, type, description)
- Implementation: Full YAML definition of the component
Canvas
The Canvas is your infinite workspace for visual Pipeline construction.
- Pan: Click and drag to move around the canvas
- Zoom: Scroll or use zoom controls to adjust view
- Mini-map: Bottom-left corner shows your current position in the pipeline
Canvas toolbar
The Canvas Toolbar provides a set of essential tools to manage and navigate your Pipeline workspace:
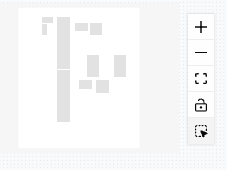
- Mini-map: Offers a visual overview of your entire pipeline layout, letting you quickly jump to different areas.
- Zoom In/Out: Adjusts the canvas scale so you can focus on details or see the bigger picture.
- Fit to View: Automatically rescales and centers your pipeline to fit the entire view.
- Lock: Prevents accidental movement of tasks, allowing you to navigate safely without disturbing your layout.
- Group Select: Enables you to select multiple tasks at once for bulk operations such as moving, deleting, or updating them.
Task representation
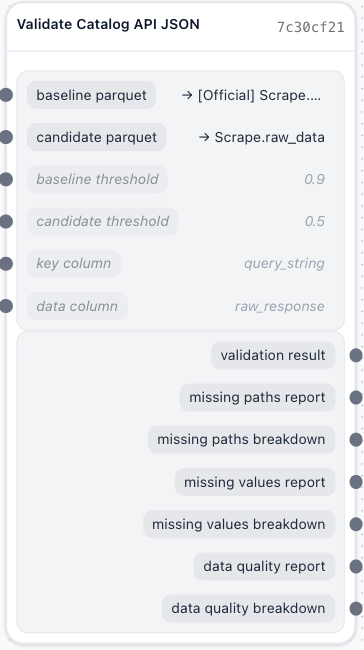
- Tasks appear as rectangles with inputs on the left, outputs on the right
- Connection points (handles) for creating data flows
- Visual indicators for validation status and recent changes. Red dot indicates a validation error.
- Click the collapse button in the node header to toggle between expanded and collapsed view. Collapsed nodes show only the node title and connection handles, reducing visual clutter on large pipelines.
Basic operations
- Add component: Drag from Component Library to Canvas
- Connect tasks: Click output handle and drag to input handle
- Move tasks: Click and drag to reposition
- Delete connection: Select connection and press Backspace
Undo/redo controls
The editor tracks the last 50 changes, and you can undo and redo changes from the bottom-right corner or using keyboard shortcuts. Changes are stored per session, and if you reload the page your history will be lost.
Group operations
To activate group operations, select Group Selection in the canvas toolbar or hold Ctrl/Cmd and click individual nodes. From there, you can:
- Delete: Remove all selected nodes and their connections.
- Duplicate: Create copies of selected nodes while preserving their connections.
- Update: Apply version updates or configuration changes to all selected nodes simultaneously. Useful when upgrading multiple components to newer versions.
- Move as group: Drag any selected node to move the entire selection while maintaining relative positions.
When multiple nodes are selected, the right panel displays a Multiselection Context Panel summarising the selected nodes by type (tasks, inputs, outputs). You can view and perform bulk actions on the selection from there.
Use Ctrl/Cmd+A to select all nodes, then deselect specific ones with Ctrl/Cmd+Click.
Tasks with validation errors will prevent pipeline execution. Check the validation section to identify and resolve issues before submitting runs.
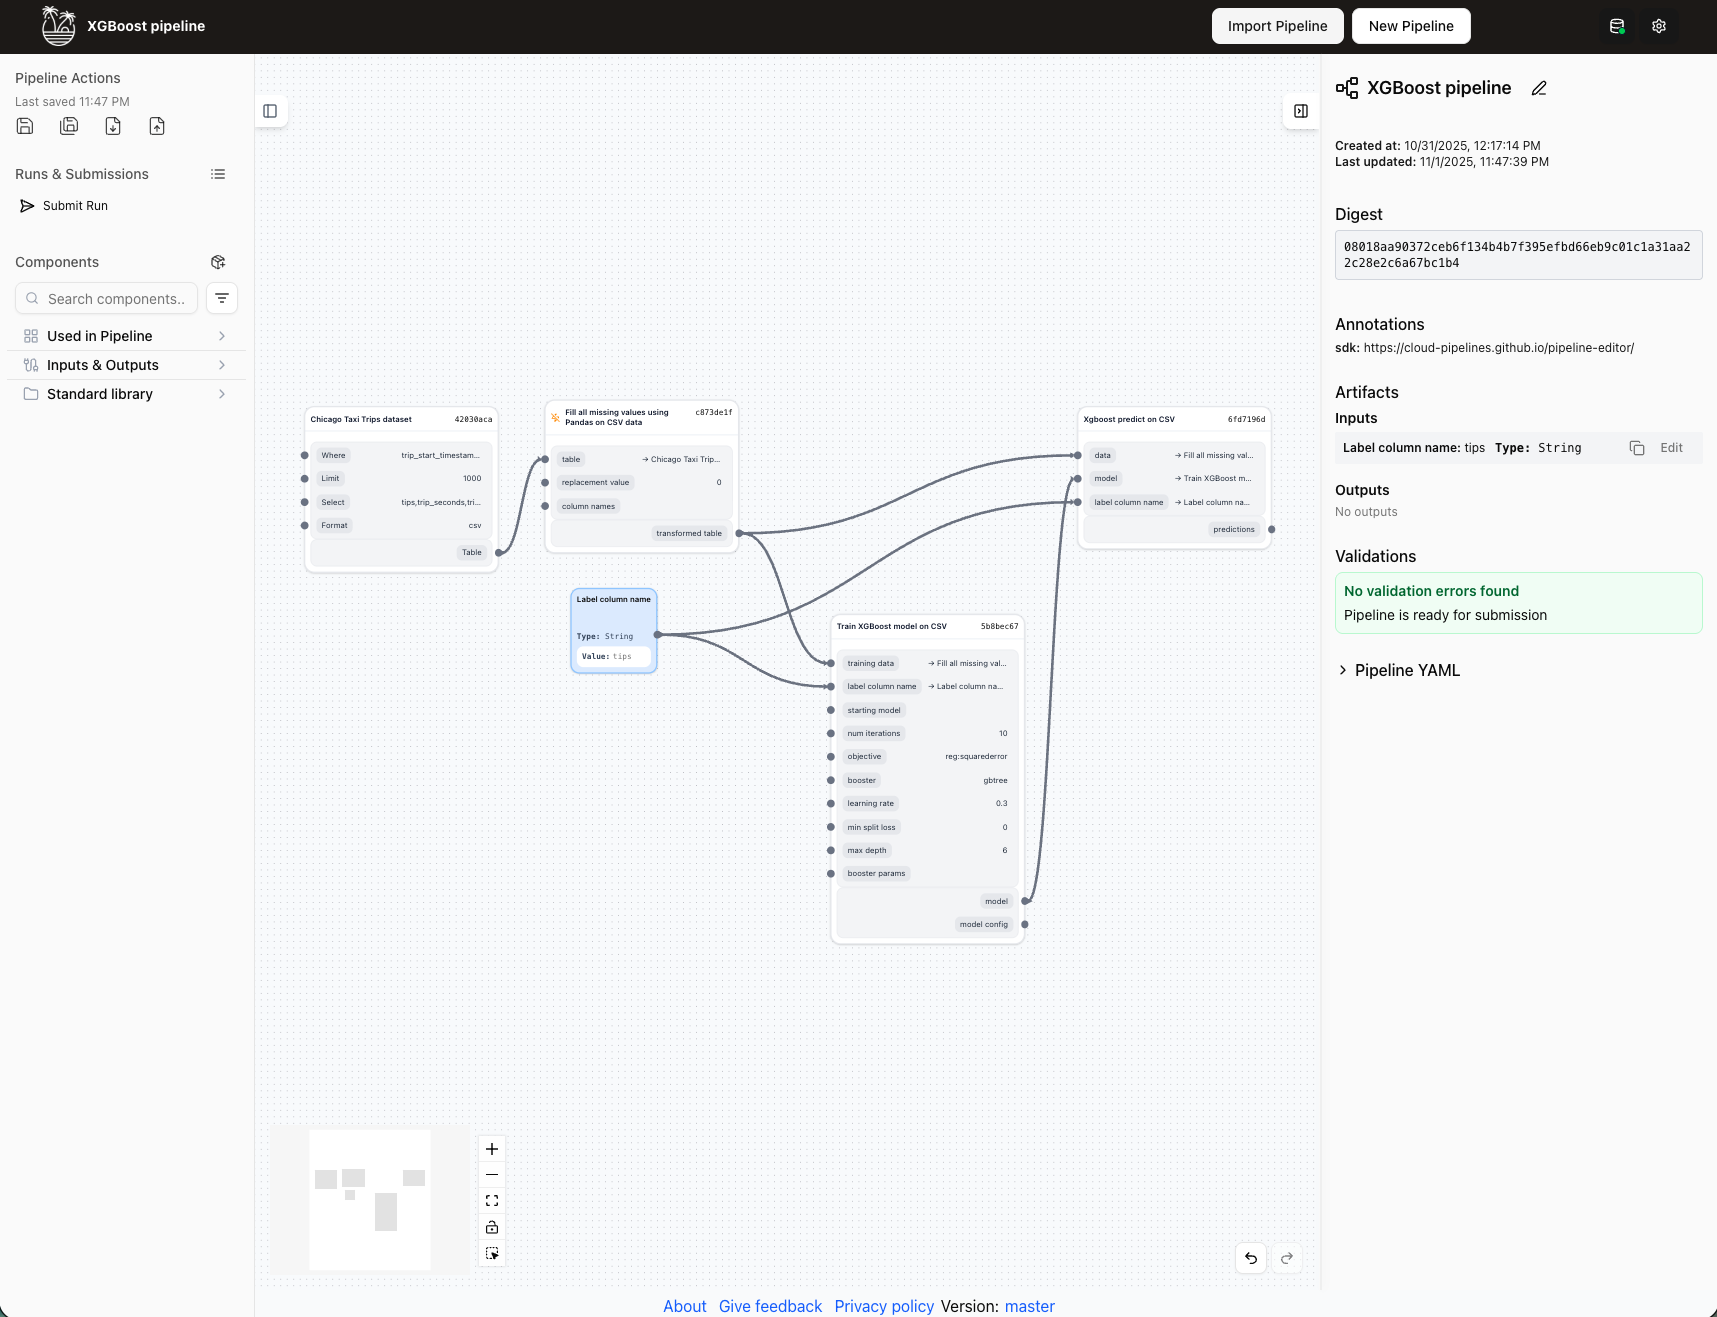
Pipeline context panel
When no Task is selected, the panel shows pipeline-level information:
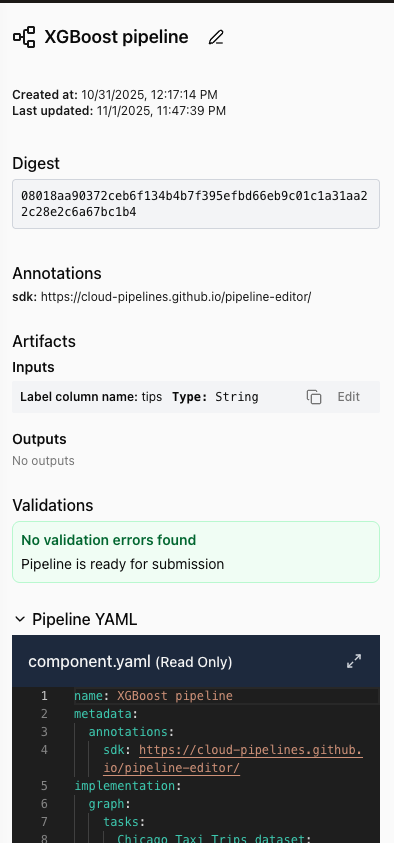
Pipeline information:
- Pipeline name with edit button
- Creation and last update timestamps
- Unique digest identifier (click to copy)
- Validation status and errors
Tags:
- Add up to 10 tags to a pipeline for categorisation and search.
- Click Add tag to create a new tag. Tags appear in the pipeline list on My Pipelines in the dashboard.
- Click an existing tag to edit or remove it.
Pipeline inputs/outputs:
- All pipeline parameters via Input/Output nodes
- Editable values for Input nodes (required)
- Copy values to clipboard
Pipeline YAML:
- View-only display of complete pipeline definition
- Full YAML content for reference
Arguments context panel
When a task is selected, the panel shows three tabs.
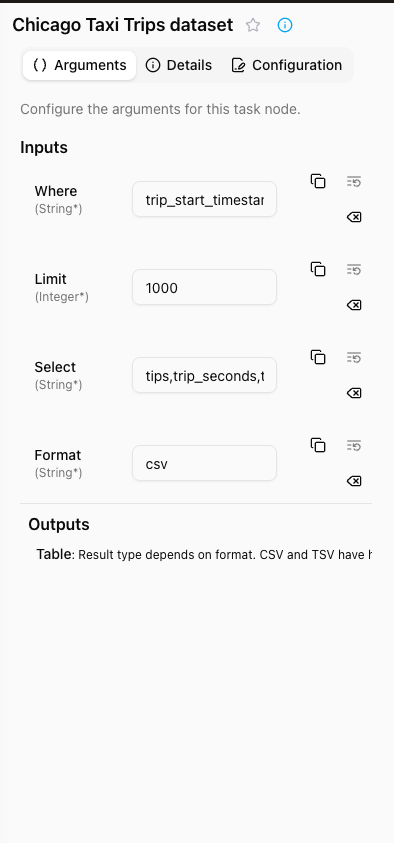
- Complete list of task inputs and outputs
- Required arguments marked with asterisk (*)
- Per-argument controls:
- Copy value to clipboard
- Reset to default value
- Exclude argument from execution
- Copy a shareable link to this node directly to your clipboard
- Green indicator for recently changed values
- Expandable multi-line editor for complex values
- Click row to view argument description
When configuring component inputs, you have several actions available through the toolbar buttons:
| Action | Icon | Description |
|---|---|---|
| Copy value | Copies the current input value to clipboard | |
| Reset to default | Resets input to its default value from YAML | |
| Exclude argument | Excludes this input from execution | |
| Include argument | Re-includes a previously excluded input | |
| Copy node link | Link icon | Copies a shareable URL that opens the pipeline run and navigates directly to this node |
Argument types
Task arguments support three input modes, selectable via the dropdown on each argument field:
- Plain value: Enter a static string, number, or other value directly.
- Secret: Reference a secret stored in Settings > Secrets. The secret value is resolved at runtime and never exposed in the pipeline definition.
- System data: Reference dynamic runtime data provided by the execution environment (for example, the current pipeline run ID or execution timestamp).
To switch an argument to a different mode, click the dynamic data dropdown icon at the right of the argument field and select the desired type.
Exclude/include argument
When you use the Exclude Argument action, the input is removed from the execution parameters. This is especially helpful for optional inputs that you do not need. The input field will become dimmed, but you can still edit its contents if you wish.
Choosing the Include Argument action will re-add a previously excluded input. This returns the input to its active state in the pipeline. If the input was empty when you include it, it may automatically be filled in with the default value.
Empty input is not the same as excluded input. Excluded input is removed from the execution parameters, while empty input is still a value that will be passed to the task execution.
Dynamic data arguments
For arguments that require sensitive or runtime-generated values, click the dynamic data button (database icon) next to an argument field to switch from a static value to a dynamic data source. Two categories are available:
- Secrets: Bind the argument to a named secret stored on the TangleML backend. The secret value is injected at execution time and never stored in the pipeline YAML. See Managing Secrets.
- System data: Use runtime-provided values such as the pipeline run ID, pipeline name, or current timestamp — useful for generating unique output paths without hardcoding values.
Understanding default values
Default values are specified in the component's YAML definition and serve as fallback values when an input is not explicitly provided. Authors specify default values in the component specification.
:::warning Default value divergence The default value shown in the UI comes from the component's YAML definition, but it may differ from what the actual component implementation uses. :::
Details Context Panel
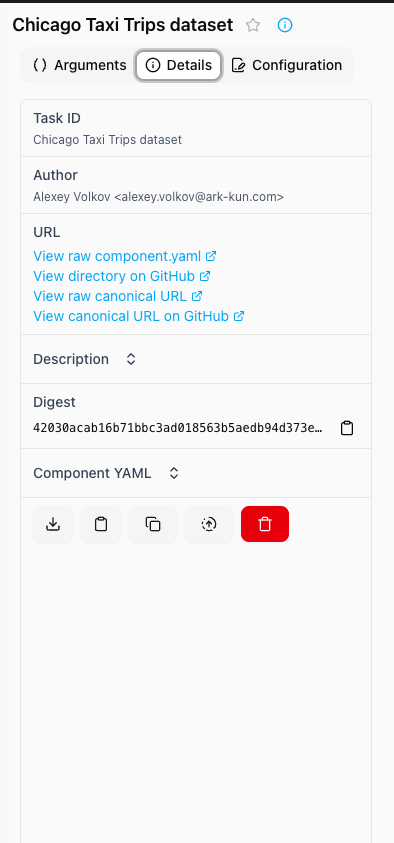
- Component information for selected Task
- Access to component YAML
- Action buttons:
- Download YAML
- Download Python code (if available)
- Copy YAML to clipboard
- Duplicate task
- Edit component definition (if enabled in preferences)
- Delete task
- Unique digest identifier
Configuration context panel
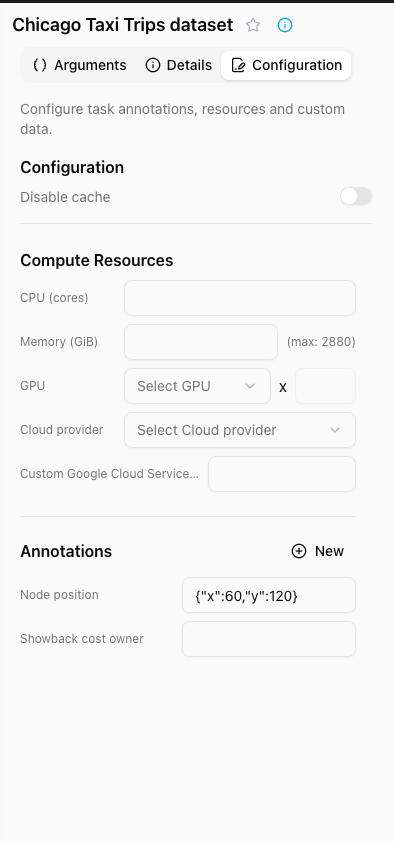
- You can disable cache for the Task.
- Configure compute resources:
- CPU cores
- Memory (GB)
- GPU enablement
- Cloud provider selection
- Custom annotations section for additional metadata
Pipeline Run view
The Pipeline Run view provides detailed insights into pipeline execution, allowing you to monitor progress, inspect outputs, and debug issues.
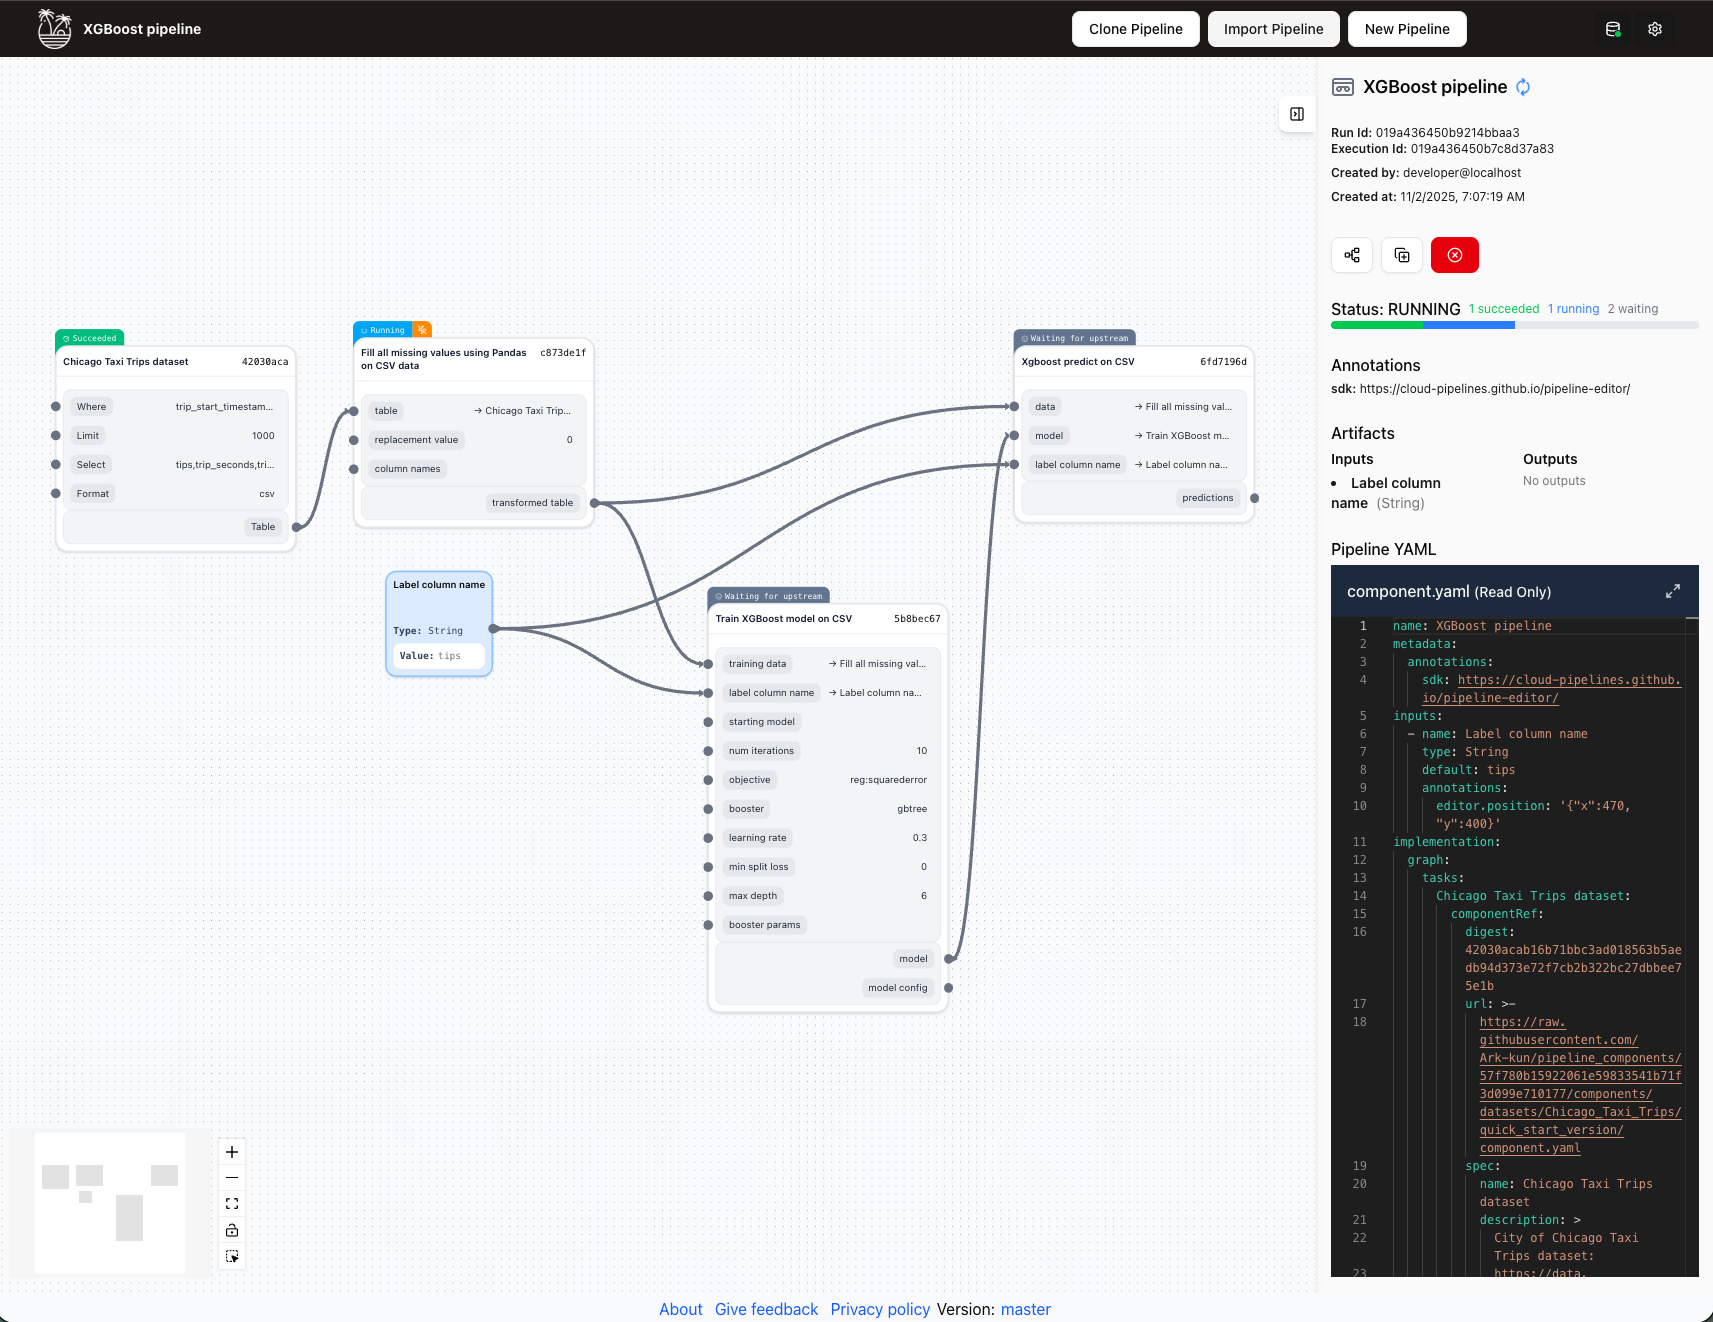
Run overview
The main area displays the pipeline graph with execution status for each task:
- Visual indicators show task status (Pending, Running, Succeeded, Failed, Skipped)
- Execution timeline and duration for completed tasks
- Real-time updates for running pipelines
- Click the collapse button on any node to hide its inputs and outputs and reduce visual clutter
Run actions
Available actions depend on run status:
- Inspect: Open the pipeline editor for the run. Only available for pipelines stored in local browser storage.
- Cancel: Stop a running pipeline. Only the user who created the run can cancel it.
- Re-run: Re-run a pipeline with the same parameters.
- Clone: Create a new pipeline from this run's configuration.
Use the logs tab to debug failed tasks. Error messages and stack traces help identify issues quickly.
Context panel
The right panel provides detailed information about the run or selected task.
Pipeline Run details (no task selected)
When viewing the overall run:
- Run status and metadata
- Start and end times
- Total duration
- Input parameters used
- Overall pipeline outputs
- Run origin: An icon next to the Run Info heading shows where this run was submitted from — the Tangle web app, a programmatic source (CLI or AI), or an unknown source. Hover the icon for a tooltip describing the origin.
Output nodes in the graph display their artifact values inline when the run has completed.
Task Execution details (task selected)
When a specific Task is selected, three tabs provide comprehensive execution information:
1. Artifacts tab
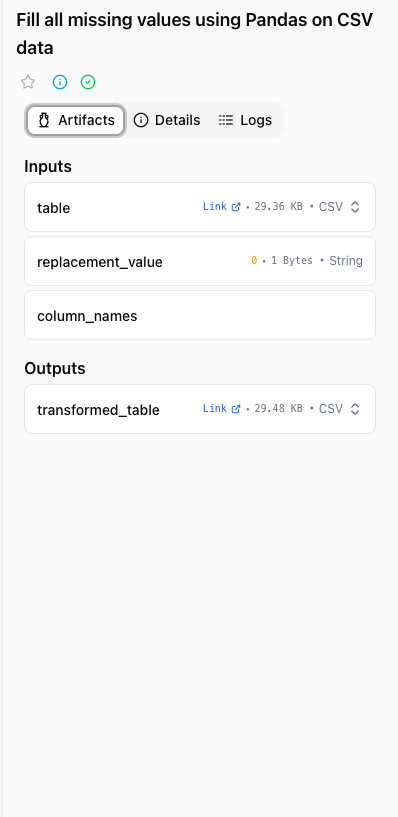
- Output artifacts produced by the Task
- Inline viewer for supported formats (text, JSON, CSV/TSV, Apache Parquet, images) — click the fullscreen button to expand, or Cmd/Ctrl + click the fullscreen button to open the artifact on its own dedicated page in a new tab
- Share button in the viewer header copies the artifact's preview URL to the clipboard so you can share or bookmark a direct link to the artifact
- Tabular artifacts (CSV, TSV, Parquet) page in batches of 100 rows up to a 1,000-row preview limit; column headers stay sticky while scrolling, and Parquet columns show their type (with
?marking nullable columns) - Download links for all artifacts
- Artifact metadata (size, type, storage location)
See Understanding Artifacts for a full list of supported viewer formats and details on the standalone artifact preview page.
2. Details tab
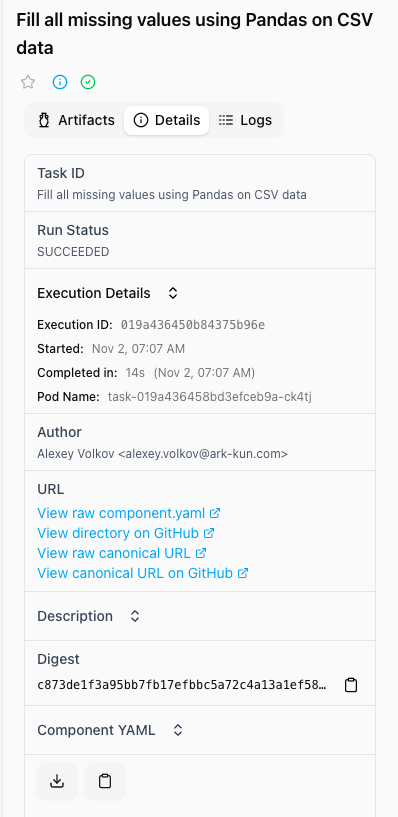
- Task Execution metadata
- Start and completion times
- Duration
- Resource usage statistics
- Component version used
- Execution environment details
3. Logs tab
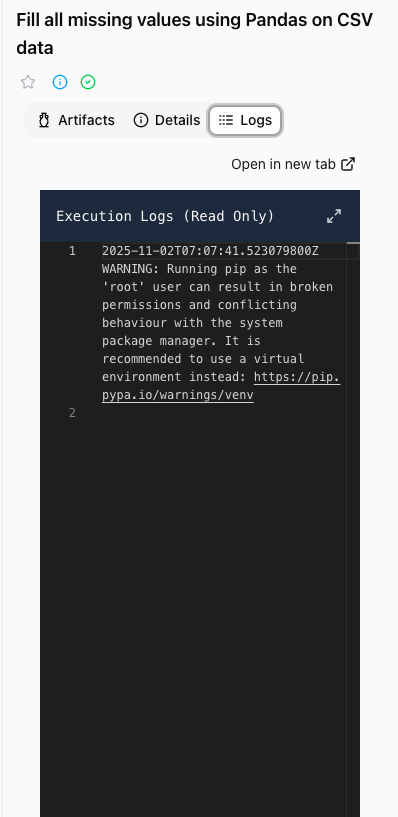
- Complete execution logs
- Stdout and stderr output
- System messages
- Error traces for debugging
- Log filtering and search capabilities
- Logs auto-scroll to the latest entry while a task is running. Scroll up to pause auto-scroll.
- Timestamps show elapsed time while the task is running and switch to absolute time after it completes.
Settings
The Settings page is accessible from the top bar and provides a sidebar layout with four sections:
Backend
Configure the connection to your TangleML backend instance:
- Backend URL: The URL of your TangleML backend.
- Connection status: Live indicator showing whether the backend is reachable.
Preferences
Adjust personal preferences that apply to your browser session:
- Theme and display options
- Editor behaviour settings
Beta Features
Enable or disable opt-in features that are still under active development. Beta features are toggled per-browser and do not affect other users.
Secrets
Store credentials for use in pipeline component arguments. Secrets are encrypted at rest and resolved at execution time — their values are never stored in the pipeline YAML.
- Add secret: Provide a name and value. The name is used to reference the secret in task arguments.
- Replace secret: Update the value of an existing secret without changing its name.
- Delete secret: Remove a secret. Any pipeline arguments referencing it will need to be updated.
To use a secret in a task argument, open the argument's dynamic data dropdown and select Secret, then choose the secret by name.
Best practices
- Save frequently: Use Save Pipeline regularly to preserve your work
- Validate before running: Check the validation panel for errors before submitting
- Use descriptions: Add meaningful descriptions to help others understand your pipeline
- Use tags: Tag pipelines with project names or status labels to make them easier to find in the pipeline list
- Organize components: Keep your User Components library organized by removing unused items
- Monitor runs: Check the All Runs view in the dashboard to track pipeline performance over time
Keyboard shortcuts & hotkeys
| Shortcut | Action |
|---|---|
Ctrl/Cmd + Z | Undo |
Ctrl/Cmd + Y | Redo |
Ctrl/Cmd + Shift + Z | Redo |
Delete/Backspace | Delete selected elements |
Shift + Delete/Backspace | Delete selected elements (skip confirmation) |
Shift + Drag | Full select multiple tasks (as a group) |
Ctrl/Cmd + Shift + Drag | Partial select multiple tasks (as a group) |
Ctrl/Cmd + Click | Select multiple tasks (individually) |
Ctrl/Cmd + A | Select all tasks |
Ctrl/Cmd + C | Copy selected tasks |
Ctrl/Cmd + V | Paste copied tasks |
Escape | Deselect all |
Troubleshooting
Common issues
Pipeline won't run:
- Check validation panel for errors
- Ensure all required inputs have values
- Verify component compatibility
Lost draft pipelines:
- Draft pipelines are stored in browser local storage
- Clearing browser data will remove drafts
- Always export important pipelines as YAML backups
Can't connect components:
- Verify input/output type compatibility
- Check for circular dependencies
- Ensure required inputs are satisfied
Remember that browser local storage has size limits. Export and backup important pipelines regularly to avoid data loss.